Red Deer Home Sales Update: Is the Market Shifting in 2026?
With only two months of data for 2026, it’s still too early to determine the market’s direction. That said, there may be some early signals. With January showing an increase in sales and February showing a decline, the trend remains unclear.
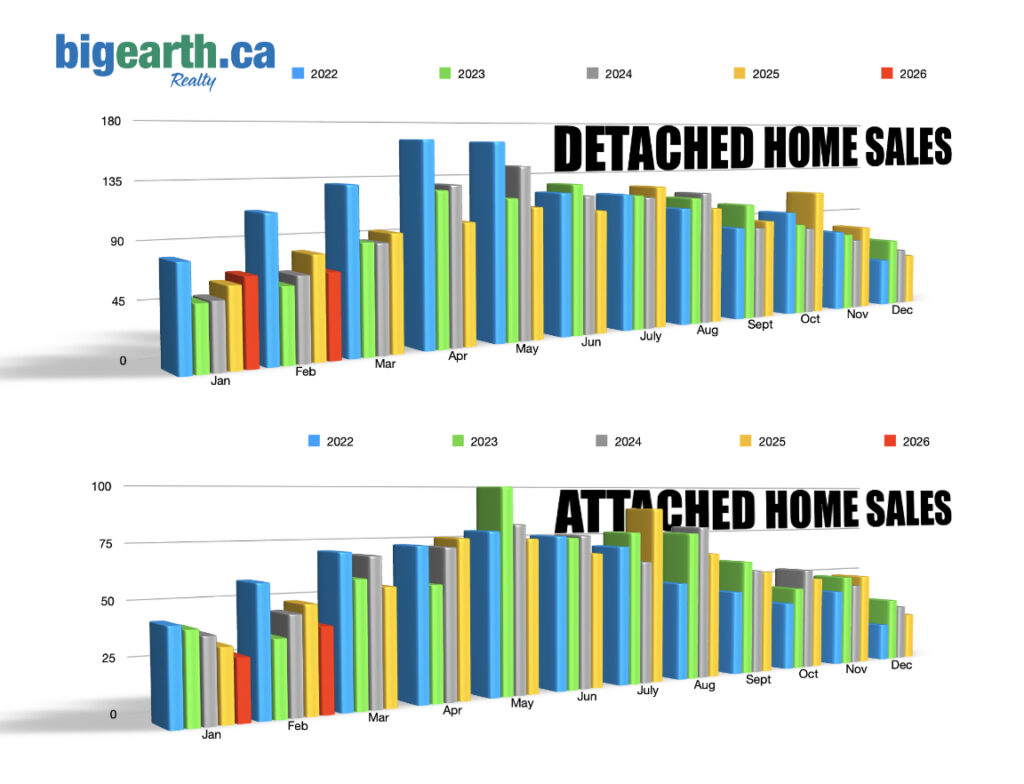
Detached Homes: Strong Start, Softer February
Looking at detached homes, January sales were up about 10% year over year, indicating strong demand to start the year. However, February shifted the other way, with sales down roughly 17% compared to last year. This suggests some month-to-month variability rather than a clear trend.
The chart below will show Red Deer detached home sales in 2026 and the 7 years prior. This allows readers to compare home sales each year and each month.*year to date.
Detached homes
2019
2020
2021
2022
2023
2024
2025
diff
2026
diff
Jan
50
51
71
81
51
52
62
⬆︎ 19%
68
⬆︎ 10%
Feb
69
59
101
113
59
66
81
⬆︎ 23%
67
⬇︎17%
Mar
72
79
126
132
88
87
94
⬆︎ 8%
Apr
96
37
169
166
126
130
100
⬇︎ 23%
May
93
59
148
164
118
144
110
⬇︎ 24%
Jun
90
97
141
121
129
118
105
⬇︎ 12%
July
99
113
108
118
117
115
124
⬆︎ 8%
Aug
76
98
117
104
113
117
103
⬇︎ 12%
Sept
79
93
119
83
105
83
89
⬆︎ 7%
Oct
71
88
98
96
84
80
114
⬆︎ 43%
Nov
66
76
86
75
72
66
78
⬆︎ 18%
Dec
49
65
88
44
63
53
47
⬇︎ 11%
For the year
910
915
1372
1298
1124
1111
1107
⬆︎ 11%
Blake King’s Home Selling System
Attached Homes: Slower Start to the Year
In the attached segment, the pattern is slightly weaker. For example, sales were down about 15% in January and fell further in February, down approximately 20% year over year. As a result, this may point to softer demand or limited inventory.
Screenshot
Overall Market: Too Early to Call a Trend
Overall, detached homes are showing more resilience, while attached homes have started the year slower. That said, with limited data, it’s too early to draw firm conclusions. The next few months will be key, as they will show whether this is a normal fluctuation or a broader trend.
The chart below displays the attached home sales in Red Deer for this year and six years back. The column on the right indicates whether sales have increased or decreased, along with the percentage change compared to the same month from the previous year.*year to date
Attached homes
2019
2020
2021
2022
2023
2024
2025
diff
2026
diff
Jan
25
18
29
43
41
38
33
⬇︎13%
28
⬇︎15%
Feb
18
20
33
59
35
45
49
⬆︎ 8.9%
39
⬇︎20%
Mar
28
22
60
71
59
69
55
⬇︎ 20%
Apr
42
24
55
73
55
75
76
⬆︎ 5.6%
May
28
16
47
79
100
82
75
⬇︎ 8.5%
Jun
35
24
65
76
75
76
67
⬇︎ 12%
July
50
48
45
70
77
62
89
⬆︎ 44%
Aug
41
35
41
50
76
79
65
⬇︎ 18%
Sept
39
47
42
44
60
55
54
⬇︎ 2%
Oct
30
28
35
36
44
54
49
⬇︎ 9%
Nov
25
42
37
41
49
44
49
⬆︎ 11%
Dec
22
23
41
20
34
30
25
⬇︎ 17%
For the year
383
307
530
662
710
706
686
⬇︎ 2.8%
Hosted by Blake King Realtor® and Big Earth Realty. Blake King continually monitors the Red Deer and Central Alberta real estate market to track changes and watch trends. With this information, he can help you make the most informed decisions when buying or selling your home. If you want to learn more about the local market and how it impacts your next real estate transaction in Red Deer, call or email him anytime at (403) 350-7672