Red Deer Home Sales Update: Is the Market Shifting in 2026?
As we step into 2026, it’s still early — one month of data never tells the full story. But January numbers can sometimes give us subtle clues about where the market may be headed.
Detached Homes: A Strong Start to the Year
January 2026 recorded 62 detached home sales in Red Deer.
That’s up 19% over January 2025.
It’s also closer to the higher-inventory years of 2021 (71 sales) and 2022 (81 sales).
Interestingly, January 2006 saw 68 sales — and that was during a much more balanced market cycle.
For context, total detached sales in 2025 finished at 1,107, virtually flat compared to 2024 (down just 0.36% year-over-year). That tells us last year held steady despite tighter inventory.
So what might January’s spike mean?
One possibility is pent-up buyer demand. Many buyers sat on the sidelines in late 2025 due to limited inventory and rising competition. If more listings have started to hit the market in early 2026 — even modestly — those buyers may be stepping in quickly.
Another interpretation: If sales volume is holding stronger while inventory slowly improves, we may begin transitioning toward a more balanced market sooner than expected.
When sales numbers resemble years where inventory was higher (like 2021–2022), it can suggest that supply constraints — not demand weakness — were the limiting factor.
It’s early, but it’s worth watching.
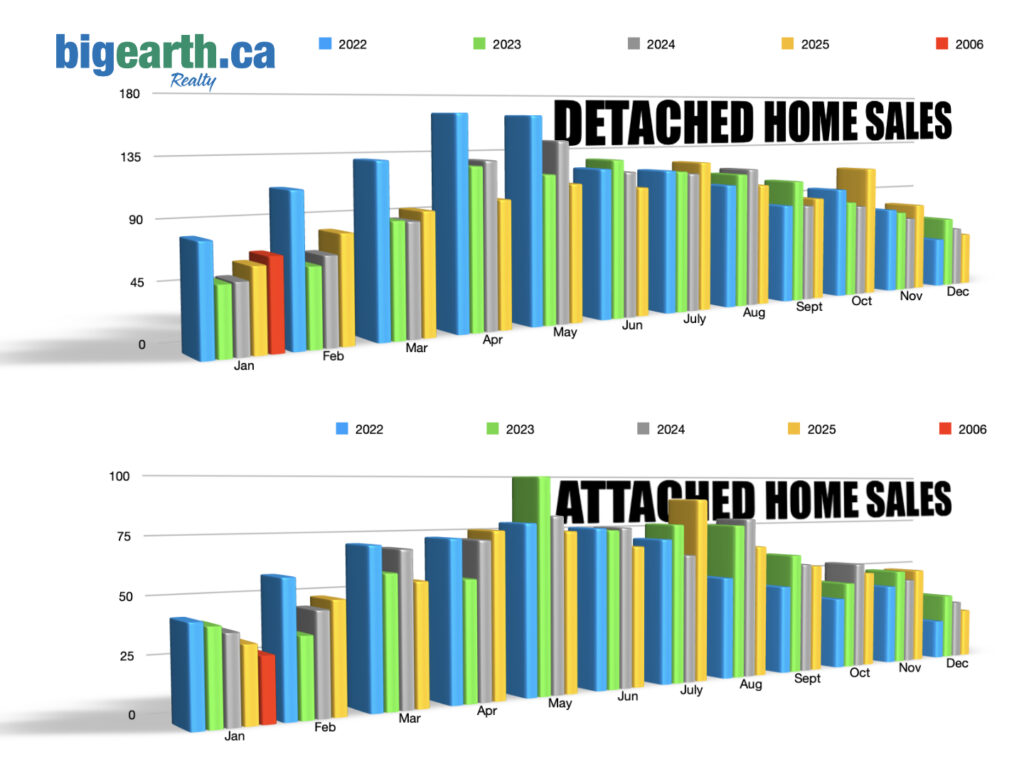
The chart below will show Red Deer detached home sales in 2026 and the 7 years prior. This allows readers to compare home sales each year and each month.*year to date.
Detached homes
2019
2020
2021
2022
2023
2024
2025
diff
2026
diff
Jan
50
51
71
81
51
52
62
⬆︎ 19%
68
⬆︎ 10%
Feb
69
59
101
113
59
66
81
⬆︎ 23%
Mar
72
79
126
132
88
87
94
⬆︎ 8%
Apr
96
37
169
166
126
130
100
⬇︎ 23%
May
93
59
148
164
118
144
110
⬇︎ 24%
Jun
90
97
141
121
129
118
105
⬇︎ 12%
July
99
113
108
118
117
115
124
⬆︎ 8%
Aug
76
98
117
104
113
117
103
⬇︎ 12%
Sept
79
93
119
83
105
83
89
⬆︎ 7%
Oct
71
88
98
96
84
80
114
⬆︎ 43%
Nov
66
76
86
75
72
66
78
⬆︎ 18%
Dec
49
65
88
44
63
53
47
⬇︎ 11%
For the year
910
915
1372
1298
1124
1111
1107
⬆︎ 11%
Attached Homes: No Clear Upward Trend (Yet)
I expected attached home sales (townhomes, duplexes, condos) to show a steady increase as detached prices climbed over the past few years.
However, the data doesn’t show a consistent upward trend.
2025 total attached sales: 686
2024 total attached sales: 706
That’s actually down 2.8% year-over-year
January 2026 saw 28 attached sales, down 15% from January 2025.
Despite affordability pressure in the detached segment, attached properties haven’t experienced a strong, steady climb in annual sales volume.
Blake King’s Home Selling System
Possible reasons:
Buyers may still be stretching for detached homes if possible.
Lifestyle preference for detached remains strong in Red Deer.
Investors may be more cautious.
Inventory composition may not align with buyer demand.
At this stage, attached sales appear more cyclical than trending upward.
Screenshot
What This Could Mean for 2026
Here’s what I’m watching closely:
Inventory levels in Q1 and Q2
Whether detached sales stay elevated beyond January
Months of supply relative to buyer activity
Price movement if supply increases faster than demand
If we see:
More listings coming on
Sales volume remains steady
Competition easing slightly
…we could move toward a balanced market environment faster than many expect.
That doesn’t mean prices drop. It simply means buyers and sellers regain negotiating balance.
The chart below displays the attached home sales in Red Deer for this year and six years back. The column on the right indicates whether sales have increased or decreased, along with the percentage change compared to the same month from the previous year.*year to date
Attached homes
2019
2020
2021
2022
2023
2024
2025
diff
2026
diff
Jan
25
18
29
43
41
38
33
⬇︎13%
28
⬇︎15%
Feb
18
20
33
59
35
45
49
⬆︎ 8.9%
Mar
28
22
60
71
59
69
55
⬇︎ 20%
Apr
42
24
55
73
55
75
76
⬆︎ 5.6%
May
28
16
47
79
100
82
75
⬇︎ 8.5%
Jun
35
24
65
76
75
76
67
⬇︎ 12%
July
50
48
45
70
77
62
89
⬆︎ 44%
Aug
41
35
41
50
76
79
65
⬇︎ 18%
Sept
39
47
42
44
60
55
54
⬇︎ 2%
Oct
30
28
35
36
44
54
49
⬇︎ 9%
Nov
25
42
37
41
49
44
49
⬆︎ 11%
Dec
22
23
41
20
34
30
25
⬇︎ 17%
For the year
383
307
530
662
710
706
686
⬇︎ 2.8%
Bottom Line
January alone doesn’t confirm a shift — but it raises interesting questions.
Detached demand is clearly present. Attached sales remain steady but not accelerating. If inventory improves, the dynamics of 2026 could look different than the tight conditions of the past few years.
I’ll continue tracking the numbers monthly.
If you’re thinking of buying or selling in 2026, understanding whether we’re entering a balanced phase — or staying in a competitive seller’s market — will matter.
More updates soon.
Hosted by Blake King Realtor® and Big Earth Realty. Blake King continually monitors the Red Deer and Central Alberta real estate market to track changes and watch trends. With this information, he can help you make the most informed decisions when buying or selling your home. If you want to learn more about the local market and how it impacts your next real estate transaction in Red Deer, call or email him anytime at (403) 350-7672