Detached home sales bounce back while attached homes continue to lag
After a slower May, June was a strong month for detached home sales in Red Deer. A total of 126 detached homes sold, up from 105 in June 2025, representing a 20% increase. That more than made up for the slower spring months, bringing detached sales exactly even with last year through the first six months of 2026.
Attached homes continue to tell a different story. 66 attached homes (half duplexes, townhomes and apartments combined) sold in June, compared with 67 last June. While June was nearly identical to last year, attached home sales remain 11% lower year-to-date, with 316 sales compared to 355 at this point in 2025.
The first half of 2026 has been a roller coaster for detached home sales:
January: up 10%
February: down 17%
March: down 12%
April: up 8%
May: down 10%
June: up 20%
Those ups and downs have balanced out almost perfectly, with 552 detached home sales recorded through June in both 2025 and 2026.
That consistency suggests buyer demand for detached homes remains healthy despite month-to-month fluctuations.
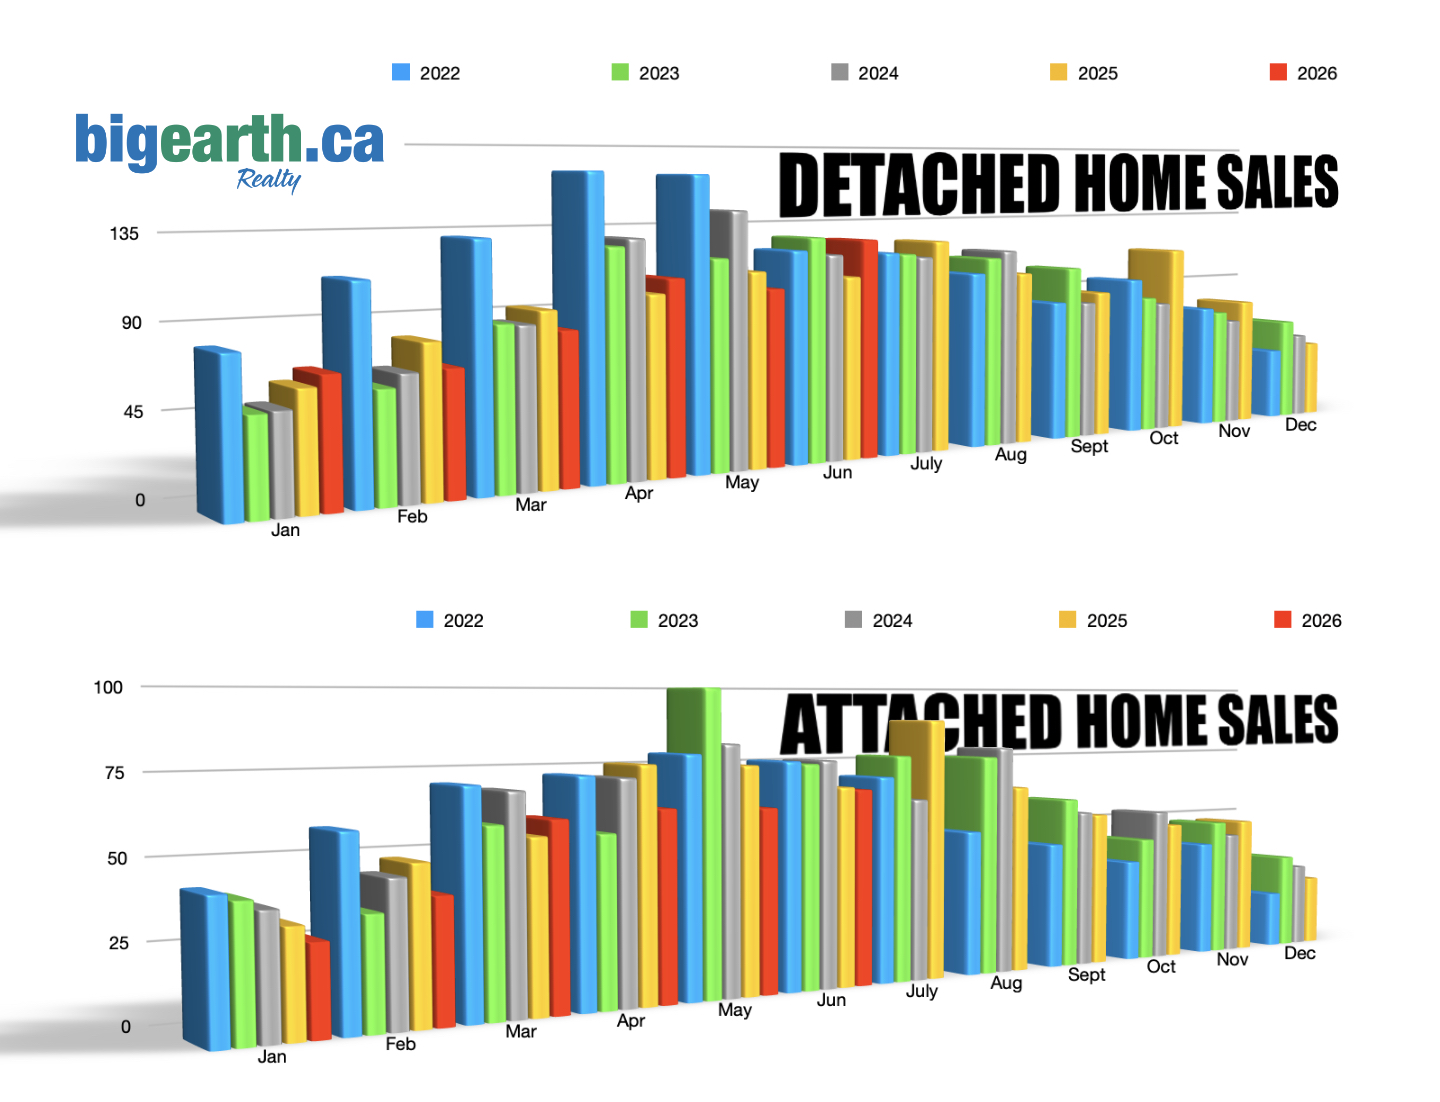
The chart below will show Red Deer detached home sales in 2026 and the 7 years prior. This allows readers to compare home sales each year and each month.*year to date.
Detached homes
2019
2020
2021
2022
2023
2024
2025
diff
2026
diff
Jan
50
51
71
81
51
52
62
⬆︎ 19%
68
⬆︎ 10%
Feb
69
59
101
113
59
66
81
⬆︎ 23%
67
⬇︎17%
Mar
72
79
126
132
88
87
94
⬆︎ 8%
83
⬇︎12%
Apr
96
37
169
166
126
130
100
⬇︎ 23%
108
⬆︎ 8%
May
93
59
148
164
118
144
110
⬇︎ 24%
100
⬇︎ 10%
Jun
90
97
141
121
129
118
105
⬇︎ 12%
126
⬆︎ 20%
July
99
113
108
118
117
115
124
⬆︎ 8%
Aug
76
98
117
104
113
117
103
⬇︎ 12%
Sept
79
93
119
83
105
83
89
⬆︎ 7%
Oct
71
88
98
96
84
80
114
⬆︎ 43%
Nov
66
76
86
75
72
66
78
⬆︎ 18%
Dec
49
65
88
44
63
53
47
⬇︎ 11%
For the year
910
915
1372
1298
1124
1111
1107
⬆︎ 11%
Blake King’s Home Selling System
Attached Homes Still Seeing Softer Demand
Attached homes have struggled to keep pace throughout most of the year.
Only March posted an increase over last year, while every other month has been lower or nearly unchanged. Through June:
2025: 355 sales
2026: 316 sales
Change:down 11%
This likely reflects buyers’ continued favouring of detached homes whenever affordability allows, while some first-time buyers and investors remain cautious.
Overall Home Sales Are Slightly Lower
Across all residential property types, 868 homes have sold in Red Deer through the end of June, compared with 907 during the same period last year. That’s a decline of about 4%.
Looking at the longer-term trend:
Year
Total Home Sales
2021
1,902
2022
1,960
2023
1,829
2024
1,817
2025
1,793
While 2026 is currently running behind last year’s pace, it’s worth remembering that the exceptionally strong markets of 2021 and 2022 were fuelled by historically low interest rates and unusually high buyer demand. Since then, higher borrowing costs have reduced affordability and naturally lowered the number of buyers able or willing to purchase homes. At the same time, prices have continued to rise in many Alberta markets, meaning fewer buyers can qualify for the homes they want.
The chart below displays the attached home sales in Red Deer for this year and six years back. The column on the right indicates whether sales have increased or decreased, along with the percentage change compared to the same month from the previous year.*year to date
Attached homes
2019
2020
2021
2022
2023
2024
2025
diff
2026
diff
Jan
25
18
29
43
41
38
33
⬇︎13%
28
⬇︎15%
Feb
18
20
33
59
35
45
49
⬆︎ 8.9%
39
⬇︎20%
Mar
28
22
60
71
59
69
55
⬇︎ 20%
60
⬆︎ 9%
Apr
42
24
55
73
55
75
76
⬆︎ 5.6%
62
⬇︎ 18%
May
28
16
47
79
100
82
75
⬇︎ 8.5%
61
⬇︎ 18.6%
Jun
35
24
65
76
75
76
67
⬇︎ 12%
66
⬇︎ 1.5%
July
50
48
45
70
77
62
89
⬆︎ 44%
Aug
41
35
41
50
76
79
65
⬇︎ 18%
Sept
39
47
42
44
60
55
54
⬇︎ 2%
Oct
30
28
35
36
44
54
49
⬇︎ 9%
Nov
25
42
37
41
49
44
49
⬆︎ 11%
Dec
22
23
41
20
34
30
25
⬇︎ 17%
For the year
383
307
530
662
710
706
686
⬇︎ 2.8%
What Does This Mean for Buyers and Sellers?
The encouraging news is that fewer sales don’t automatically mean a weaker market.
Red Deer continues to have low inventory, with about 2 months of supply year-to-date, well below what would normally be considered a balanced market. When inventory stays low, prices can continue to hold steady or rise even if fewer homes are changing hands.
For sellers, properly priced detached homes continue to attract buyers quickly.
For buyers, attached homes may offer slightly more opportunity and negotiating room than detached properties, while detached homes remain highly competitive in many price ranges.
Are Lower Sales Becoming the New Normal?
The gradual decline in annual sales since the 2022 peak doesn’t necessarily indicate a weakening real estate market.
Several factors are likely contributing:
Higher mortgage rates have reduced affordability compared with 2021–2022.
Home prices have risen over the past several years, requiring larger down payments and higher qualifying incomes.
Population growth has supported prices, but not every new resident purchases immediately—many rent first.
A limited supply of homes means there are simply fewer properties available to sell at any one time.
If mortgage rates continue to ease over the next year or two, we could see sales volumes begin to recover. Until then, Red Deer appears to be settling into a market with fewer transactions but continued price support because inventory remains relatively tight.
Hosted by Blake King Realtor® and Big Earth Realty. Blake King continually monitors the Red Deer and Central Alberta real estate market to track changes and watch trends. With this information, he can help you make the most informed decisions when buying or selling your home. If you want to learn more about the local market and how it impacts your next real estate transaction in Red Deer, call or email him anytime at (403) 350-7672