Red Deer Home Sales 2026: Detached Sales Rebound in April
Red Deer home sales showed mixed results in April 2026. Detached homes posted their strongest month of the year, while attached homes continued to trail last year’s pace.
After a slower first quarter, detached home sales rebounded in April and have now nearly caught up to 2025 levels. Attached home sales, however, remain noticeably below where they were at this point last year.
Detached Home Sales in Red Deer
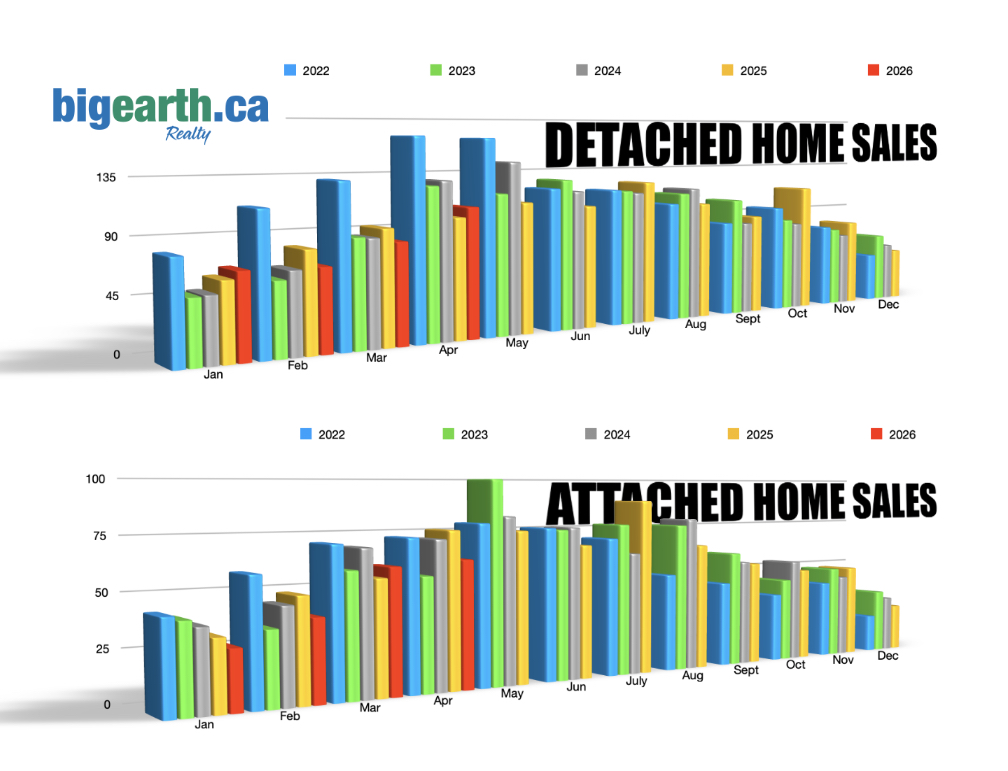
April was an encouraging month for detached home sales. Following year-over-year declines in February and March, detached home sales increased in April, helping narrow the gap with 2025.
Through the first four months of 2026, 326 detached homes have sold compared to 337 during the same period in 2025. Detached sales are now only 4% behind last year’s pace.
The improvement suggests buyer demand remains healthy despite higher prices and affordability challenges. While activity was slower earlier in the year, April’s rebound indicates many buyers are still actively searching when suitable homes become available.
The chart below will show Red Deer detached home sales in 2026 and the 7 years prior. This allows readers to compare home sales each year and each month.*year to date.
Detached homes
2019
2020
2021
2022
2023
2024
2025
diff
2026
diff
Jan
50
51
71
81
51
52
62
⬆︎ 19%
68
⬆︎ 10%
Feb
69
59
101
113
59
66
81
⬆︎ 23%
67
⬇︎17%
Mar
72
79
126
132
88
87
94
⬆︎ 8%
83
⬇︎12%
Apr
96
37
169
166
126
130
100
⬇︎ 23%
108
⬆︎ 8%
May
93
59
148
164
118
144
110
⬇︎ 24%
Jun
90
97
141
121
129
118
105
⬇︎ 12%
July
99
113
108
118
117
115
124
⬆︎ 8%
Aug
76
98
117
104
113
117
103
⬇︎ 12%
Sept
79
93
119
83
105
83
89
⬆︎ 7%
Oct
71
88
98
96
84
80
114
⬆︎ 43%
Nov
66
76
86
75
72
66
78
⬆︎ 18%
Dec
49
65
88
44
63
53
47
⬇︎ 11%
For the year
910
915
1372
1298
1124
1111
1107
⬆︎ 11%
Blake King’s Home Selling System
Attached Home Sales in Red Deer
Attached home sales have followed a different path in 2026.
Although sales improved in March, April activity fell below last year’s level, leaving the attached market further behind than the detached segment.
Through April, 189 attached homes have sold compared to 213 during the same period in 2025, placing sales approximately 11% below last year’s pace.
While attached homes continue to sell, buyers appear to be more selective than they were a year ago. Increased inventory and affordability considerations may also be contributing to the slower sales pace.
What This Likely Means for the Market
The biggest takeaway from April is that detached home demand remains resilient. Despite rising prices over the past few years, buyers continue to enter the market and purchase homes when inventory becomes available.
The attached market appears to be experiencing more resistance, although sales volumes remain relatively healthy by historical standards.
Inventory will continue to be the key factor to watch throughout the remainder of the spring and summer market. More listings could help improve buyer choice and reduce some of the competitive pressure that has existed over the past several years. On the other hand, if inventory remains limited, prices could continue to see upward pressure even if sales volumes remain below 2025 levels.
The chart below displays the attached home sales in Red Deer for this year and six years back. The column on the right indicates whether sales have increased or decreased, along with the percentage change compared to the same month from the previous year.*year to date
Attached homes
2019
2020
2021
2022
2023
2024
2025
diff
2026
diff
Jan
25
18
29
43
41
38
33
⬇︎13%
28
⬇︎15%
Feb
18
20
33
59
35
45
49
⬆︎ 8.9%
39
⬇︎20%
Mar
28
22
60
71
59
69
55
⬇︎ 20%
60
⬆︎ 9%
Apr
42
24
55
73
55
75
76
⬆︎ 5.6%
62
⬇︎ 18%
May
28
16
47
79
100
82
75
⬇︎ 8.5%
Jun
35
24
65
76
75
76
67
⬇︎ 12%
July
50
48
45
70
77
62
89
⬆︎ 44%
Aug
41
35
41
50
76
79
65
⬇︎ 18%
Sept
39
47
42
44
60
55
54
⬇︎ 2%
Oct
30
28
35
36
44
54
49
⬇︎ 9%
Nov
25
42
37
41
49
44
49
⬆︎ 11%
Dec
22
23
41
20
34
30
25
⬇︎ 17%
For the year
383
307
530
662
710
706
686
⬇︎ 2.8%
The Bottom Line
April was a positive month for Red Deer detached home sales. After a slower start to the year, detached sales have nearly caught up to last year’s pace and remain supported by strong buyer demand.
Attached home sales continue to lag behind 2025 levels, but overall market activity remains healthy. As we move deeper into the spring market, inventory levels and buyer demand will likely determine whether 2026 finishes close to, above, or below the strong results recorded in 2025.
Hosted by Blake King Realtor® and Big Earth Realty. Blake King continually monitors the Red Deer and Central Alberta real estate market to track changes and watch trends. With this information, he can help you make the most informed decisions when buying or selling your home. If you want to learn more about the local market and how it impacts your next real estate transaction in Red Deer, call or email him anytime at (403) 350-7672