Local real estate chatter is that prices and sales are down, but there’s more to that story.
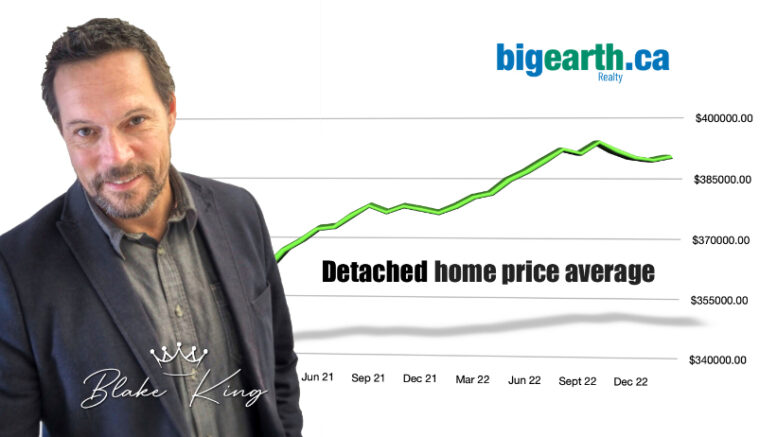
The chart below shows real estate prices over 36 months for both detached homes and homes overall. This way everyone can see where Red Deer home prices were and what’s happening with them. 2023 will be an interesting year for the Central Alberta real estate market and it will be extra interesting to see what happens with home prices.
The two charts below compare detached home prices to home prices overall. And the difference between the two is part of what’s confusing everyone.
Are home prices in the Red Deer market actually decreasing? The overall price average has dropped but that doesn’t always mean home prices are down, only that more sales are happening in a lower price range.
For example. If the majority of homes were selling in the $300,000 – $350,000 before the higher interest rates, and now the majority of homes are selling in the $270,000 – $320,000 range. Attached homes, semi-detached homes, and townhouses aren’t selling for less than they did last year. But because the most active price range is lower now the news gets skewed.
The average sale price of all the homes sold in Red Deer is lower, but the price of specific properties is not decreasing.
Overall, home prices are actually increasing. More homes are being sold in a lower price range but in each range, prices are gradually increasing due to very low inventory.
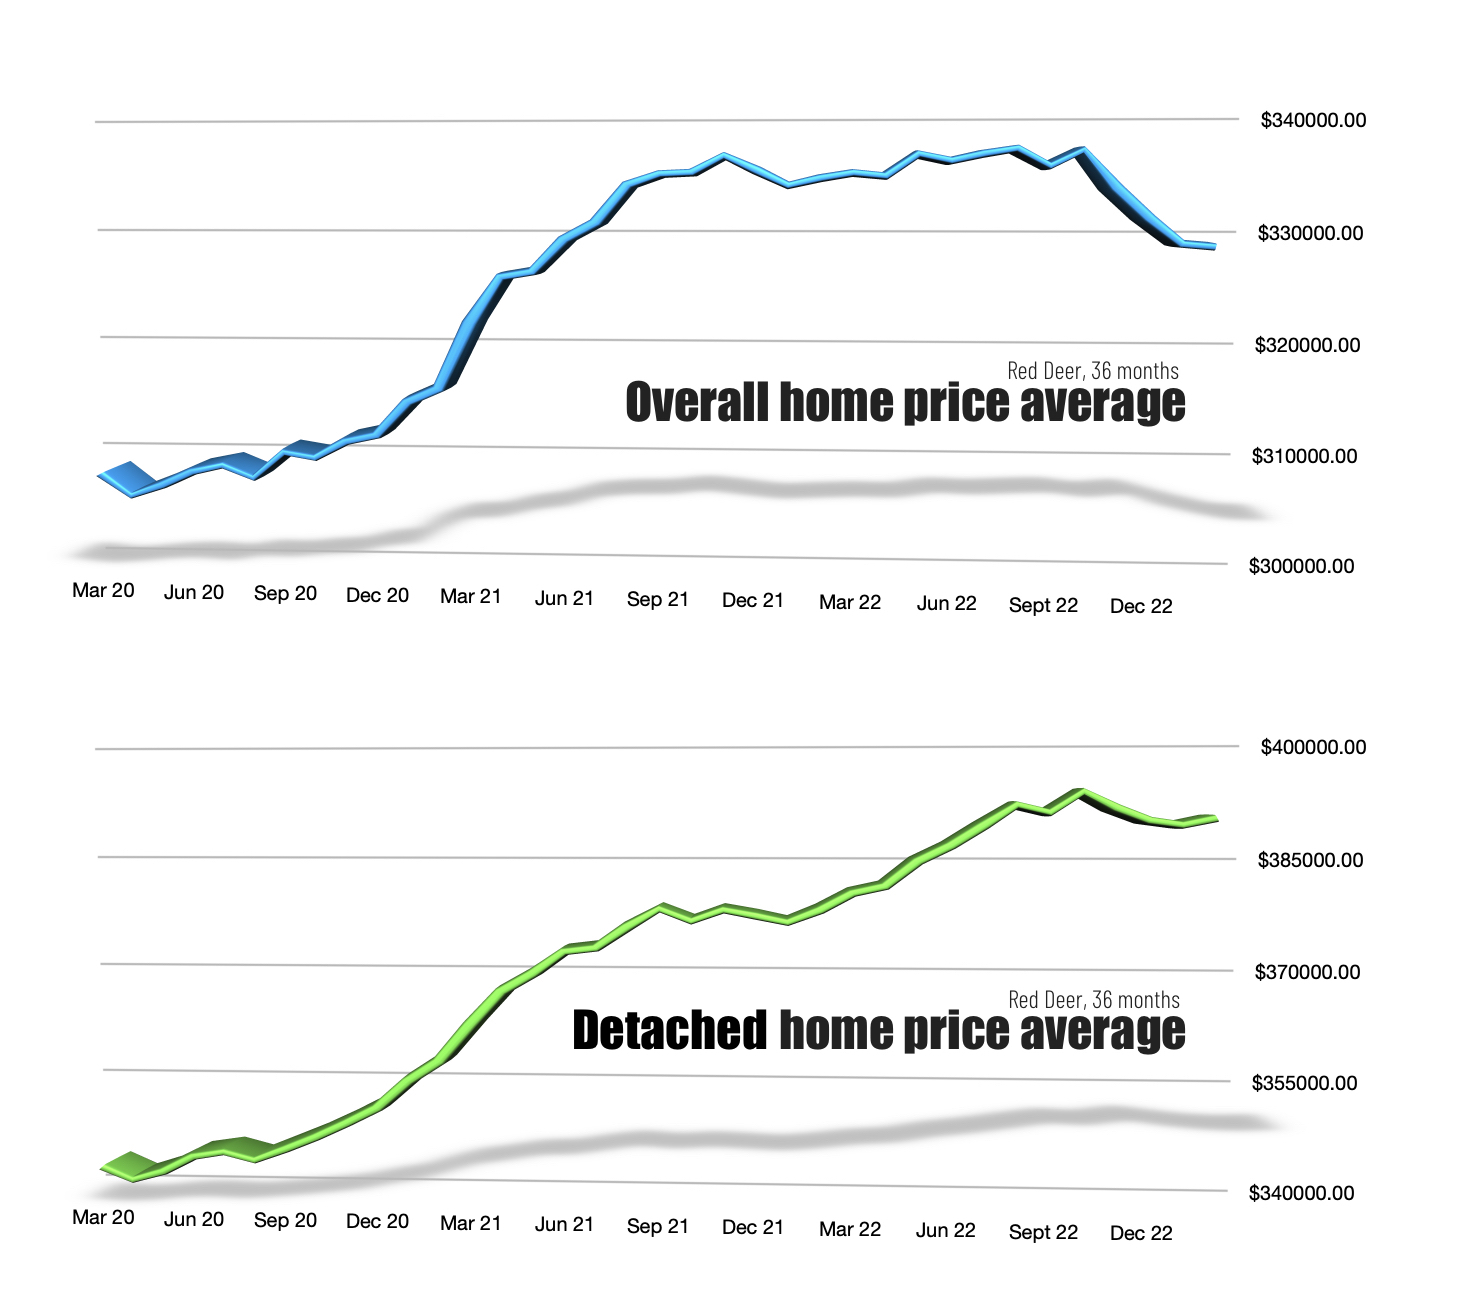
You’ll see in the chart above that detached home prices – other than the typical Dec. and Jan. – are increasing. It’s even more clear in the table below.
The table below tracks the average detached home price and the average home prices overall in Red Deer. It includes both the month-to-month average and the 12-month running average for both. From month to month, the average price is all over the place but the 12-month running average gives a better look at how prices are trending.
The table below goes back 13 months so you can compare the most recent average to the price average of the same month a year earlier.
Overall home prices
You’ll see in the table below that prices dipped at the end of the year but have recovered for the most part now. The monthly price average overall in March 2022 was $335,975 and the average in March 2023 is only 0.08% lower now. Less than 1%. Shouldn’t prices be lower now that interest rates are higher? In theory, they should, however, when inventory is low prices increase.
| Overall | ooo | Detached | |||
| Month | Average | 12-month avg. | Average | 12-month avg. | |
| Mar 2022 | $335,975 | $334,728 ⬆︎ | $393,789 | $378,929 ⬆︎ | |
| Apr 2022 | $348,134 | $335,163 ⬆︎ | $404,061 | $381,081 ⬆︎ | |
| May 2022 | $343,666 | $334,903 ⬇︎ | $396,107 | $381,967 ⬆︎ | |
| June 2022 | $348,628 | $336,720 ⬆︎ | $413,574 | $385,105 ⬆︎ | |
| July 2022 | $343,101 | $336,165 ⬇︎ | $416,991 | $387,061 ⬆︎ | |
| Aug 2022 | $338,850 | $336,747 ⬆︎ | $394,765 | $389,573 ⬆︎ | |
| Sept 2022 | $342,398 | $337,167 ⬆︎ | $408,881 | $392,134⬆︎ | |
| Oct 2022 | $320,941 | $335,725 ⬇︎ | $376,165 | $391,176 ⬇︎ | |
| Nov 2022 | $332,885 | $337,029 ⬆︎ | 385,705 | $393,765 ⬆︎ | |
| Dec 2022 | $301,766 | $333,908 ⬇︎ | $359,519 | $391,742 ⬇︎ | |
| Jan 2023 | $283,526 | $331,407 ⬇︎ | $347,922 | $390,200 ⬇︎ | |
| Feb 2023 | $311,949 | $329,283 ⬇︎ | $378,131 | $389,634 ⬇︎ | |
| Mar 2023 | $333,211 | $329,053 ⬇︎ | $403,743 | $390,464 ⬆︎ |
The 12-month average flops around less but that’s why it’s a more accurate measure of what the market is actually doing. The 12-month running average overall is also only a little lower now than it was in March 2022.
Detached home prices
Detached home prices show what’s happening in a specific price range. Again, shouldn’t prices be decreasing?
The average price for detached homes sold in March 2022 was $393,789. And in March 2023 it is $403,743. Because it only takes one or two higher-priced homes to skew the average, the month-to-month average isn’t enough to indicate detached home prices are increasing, but the 12-month running average is.
The 12-month running average price for detached homes sold in March 2022 was $378,922. And in March 2023 it is $390,463. Based on the information above, detached home prices have increased by 3% since this time last year. And, if current the homes-for-sale inventory levels have anything to say about it, we could see home prices in each price range increase.
Price changes affect buyers and sellers differently
As a Realtor, it’s hard to hope one way or another with home prices because whatever direction it takes it impacts either buyers or sellers differently.
If a person is planning to buy this year now might be the best time. We could see home prices up 3-6% by this time next year. If you are thinking about selling waiting might earn you a higher price. However, if you are planning to sell your current home to buy a more expensive one, don’t wait until prices are 6% higher.
If you wait to sell your $325,000 home in 12 months, it could be worth $344,500 (19,500 higher), but the $425,000 home you plan to buy will be $25,500 higher. There are more variables to consider than just the one above but it might help as a guideline.
Check back each month at iOnRealEstate.ca to see where local real estate prices are doing.

Hosted by Blake King Realtor® and Big Earth Realty. Blake continually monitors the Red Deer and Central Alberta real estate market to track changes and watch trends so he can help his clients make the most informed decisions, buying or selling. If you want to learn more about how local market stats impact your next real estate transaction call or email Blake anyti