Understanding real estate inventory levels, or Months of Inventory (M.O.I.), is crucial because it can significantly influence your decision when buying or selling property. It is important to grasp the reasons behind its importance in the real estate landscape.
SUMMARY!
The housing inventory in Central Alberta remains largely unchanged, with almost all communities in an extreme seller’s market—except Stettler, AB, which has a more balanced market. Without an increase in inventory, prices are likely to keep rising.
Despite demand, builders aren’t constructing new homes due to high costs that make profitable pricing difficult. They’re waiting for existing home prices to rise enough to bridge this gap. This means it could be a long time before inventory levels stabilize.
If you’d like access to unlisted and off market homes, bank foreclosures, distressed sales, company owned homes, new construction close-outs, and other great deals. – CLICK HERE.

To foster “normal growth” in a real estate market, it’s essential to maintain months of inventory (M.O.I.) rates below the 5-month range. Please scroll down for this month’s inventory rates across Central Alberta.
When buying or selling property, it’s important to consider local inventory levels. This is key information, especially if you’re thinking of selling your home. If there are many homes for sale, prices usually stay the same or go down. But if there are fewer homes available, they tend to sell quickly, which can drive prices up.
(Seller’s market) with an inventory rate below 3.9 months-of-inventory
———————————————–
(Balanced market) with inventory between 3.9-4.2 months-of-inventory
———————————————–
(Buyers market) level A (4.3 – 5.9 months of inventory)
(Buyer market) level B (6 – 7.2 m.o.i.)
(Buyers market) extreme (7.3+ m.o.i.)
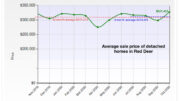
Here are the overall for-sale inventory levels in Red Deer and towns across Central Alberta. The average number of homes sold monthly is calculated based on the last 60 days of sales.
Red Deer, AB (inventory of detached homes)
| Date 2024 | Jan 2 | Feb 1 | Mar 5 | Apr 17 | May 21 | June 24 | July 15 | Aug 15 | Sept 10 | Oct 17 | Nov 05 | Dec 09 |
| properties currently for sale | 113 | 122 | 116 | 108 | 130 | 160 | 173 | 176 | 146 | 132 | 115 | 107 |
| avg # of homes selling ea. month | 67.5 | 52.5 | 64 | 102 | 125 | 132 | 130 | 105.5 | 102.5 | 96 | 84 | 74.5 |
| M.O.I. in Red Deer | 1.7 | 2.3 | 1.8 | 1. | 1. | 1.2 | 1.3 | 1.7 | 1.4 | 1.4 | 1.4 | 1.4 |
Red Deer, Ab (for sale inventory overall)
| Date 2024 | Jan 2 | Feb 1 | Mar 5* | Apr 17 | May 21 | June 24 | July 15 | Aug 15 | Sept 10 | Oct 17 | Nov 05 | Dec 09 |
| properties currently for sale | 169 | 184 | 184 | 180 | 204 | 233 | 241 | 238 | 219 | 188 | 158 | 140 |
| avg # of homes selling ea. month | 108.5 | 89 | 106 | 170 | 195 | 205 | 205 | 172 | 167 | 158.5 | 137.5 | 119 |
| M.O.I. in Red Deer | 1.6 | 2.1 | 1.7 | 1 | 1 | 1.1 | 1.2 | 1.4 | 1.3 | 1.2 | 1.2 | 1.2 |
(SELLER’S MARKET) with an inventory rate below 3.9 months!
*Before February 2024 inventory data was from detached home sales only, now each month inventory will be posted based on homes for sale inventory overall in each community. Red Deer data will include the overall inventory and the detached home inventory.
Homes for sale inventory numbers stay the same in Red Deer, Ab.
Sylvan Lake, AB (for sale inventory overall)
| Date 2024 | Jan 2 | Feb 1* | Mar 5* | Apr 17 | May 21 | June 24 | July 15 | Aug 15 | Sept 10 | Oct 17 | Nov 05 | Dec 09 |
| properties currently for sale | 30 | 76 | 79 | 96 | 79 | 93 | 73 | 92 | 73 | 55 | 60 | 56 |
| avg # of homes selling ea. month | 11 | 22.5 | 37 | 48 | 57.5 | 55.5 | 55.5 | 48 | 47 | 43 | 39.5 | 30.5 |
| M.O.I. in Red Deer | 2.7 | 3.4 | 2.1 | 2 | 1.4 | 1.7 | 1.3 | 1.9 | 1.6 | 1.3 | 1.5 | 1.8 |
(SELLER’S MARKET) with an inventory rate below 3.9 months!
*Before February 2024 inventory data was from detached home sales only, now each month inventory will be posted based on homes for sale inventory overall in each community.
Buying slows a fair bit in Sylvan Lake in the winter. If inventory gets higher it’s a good thing for everyone.
Penhold/Springbrook, Ab (for sale inventory overall)
| Date 2024 | Jan 2 | Feb 1* | Mar 5* | Apr 17 | May 21 | June 24 | July 15 | Aug 15 | Sept 10 | Oct 17 | Nov 05 | Dec 09 |
| properties currently for sale | 5 | 13 | 18 | 15 | 13 | 13 | 14 | 13 | 10 | 10 | 14 | 9 |
| avg # of homes selling ea. month | 6 | 5.5 | 3.5 | 12 | 13 | 19 | 17 | 15 | 16 | 13 | 12.5 | 8.5 |
| M.O.I. in Red Deer | 0.8 | 2.4 | 5 | 1.3 | 1 | 0.7 | 0.8 | 0.9 | 0.6 | 0.8 | 1.15 | 1.06 |
(SELLER’S MARKET) with an inventory rate below 3.9 months!
*Before February 2024 inventory data was from detached home sales only, now each month inventory will be posted based on homes for sale inventory overall in each community.
Very low inventory but not a large enough sample size to gauge a trend
Blackfalds, AB (for sale inventory overall)
| Date 2024 | Jan 2 | Feb 1* | Mar 5* | Apr 17 | May 21 | June 24 | July 15 | Aug 15 | Sept 10 | Oct 17 | Nov 05 | Dec 09 |
| properties currently for sale | 19 | 32 | 24 | 15 | 18 | 23 | 31 | 27 | 38 | 28 | 29 | 29 |
| avg # of homes selling ea. month | 9.5 | 11.5 | 14.5 | 23.5 | 21.5 | 25 | 27 | 29.5 | 25.5 | 26 | 27 | 20.5 |
| M.O.I. in Red Deer | 2 | 2.8 | 1.7 | 0.6 | 0.8 | 0.9 | 1.1 | 0.9 | 1.5 | 1.1 | 1.1 | 1.4 |
SELLER’S MARKET) with an inventory rate below 3.9 months!
*Before February 2024 inventory data was from detached home sales only, now each month inventory will be posted based on homes for sale inventory overall in each community.
A slight inventory correction in Blackfalds, Alberta.

Lacombe, AB (for sale inventory overall)
| Date 2024 | Jan 2 | Feb 1* | Mar 5* | Apr 17 | May 21 | June 24 | July 15 | Aug 15 | Sept 10 | Oct 17 | Nov 05 | Dec 09 |
| properties currently for sale | 16 | 33 | 30 | 30 | 33 | 42 | 39 | 48 | 45 | 48 | 53 | 47 |
| avg # of homes selling ea. month | 7.5 | 10.5 | 14.5 | 17.5 | 23.5 | 25.5 | 27.5 | 19.5 | 15 | 23 | 22 | 17.5 |
| M.O.I. in Red Deer | 2.1 | 3.1 | 2.1 | 1.7 | 1.4 | 1.6 | 1.4 | 2.5 | 3 | 2.1 | 2.4 | 2.7 |
(SELLER’S MARKET) with an inventory rate below 3.9 months!
*Before February 2024 inventory data was from detached home sales only, now each month inventory will be posted based on homes for sale inventory overall in each community.
The Lacombe, Alberta market is shaping up better than some other communities in Central Alberta.
Innisfail, AB (for sale inventory overall)
| Date 2024 | Jan 2 | Feb 1* | Mar 5* | Apr 17 | May 21 | June 24 | July 15 | Aug 15 | Sept 10 | Oct 17 | Nov 05 | Dec 09 |
| properties currently for sale | 16 | 28 | 22 | 16 | 18 | 21 | 21 | 28 | 18 | 17 | 16 | 13 |
| avg # of homes selling ea. month | 3 | 3 | 8 | 18 | 14 | 14.5 | 18 | 16 | 15 | 14.5 | 11.5 | 9.5 |
| M.O.I. in Red Deer | 5.3 | 9.3 | 2.8 | 0.9 | 1.3 | 1.4 | 1.2 | 1.8 | 1.2 | 1.2 | 1.4 | 1.4 |
(SELLER’S MARKET) with an inventory rate below 3.9 months!
*Before February 2024 inventory data was from detached home sales only, now each month inventory will be posted based on homes for sale inventory overall in each community.
There is still silly-low inventory in Innisfail, Alberta as we hit the last month of 2024.
Rocky Mountain House (for sale inventory overall)
| Date 2024 | Jan 2 | Feb 1* | Mar 5* | Apr 17 | May 21 | June 24 | July 15 | Aug 15 | Sept 10 | Oct 17 | Nov 05 | Dec 09 |
| properties currently for sale | 15 | 24 | 30 | 40 | 35 | 34 | 23 | 23 | 21 | 20 | 19 | 12 |
| avg # of homes selling ea. month | 4.5 | 3.5 | 4.5 | 7.5 | 11 | 18.5 | 19.5 | 18 | 18 | 14.5 | 8 | 8 |
| M.O.I. in Red Deer | 3.3 | 6.9 | 6.7 | 5.2 | 3.2 | 1.8 | 1.2 | 1.3 | 1.2 | 1.4 | 2 | 1.5 |
(SELLER’S MARKET) with an inventory rate below 3.9 months!
*Before February 2024 inventory data was from detached home sales only, now each month inventory will be posted based on homes for sale inventory overall in each community.
End-of-the-year inventory in RMH follows the rest of Central Alberta’s shortage of housing.
Ponoka, AB (for sale inventory overall)
| Date 2024 | Jan 2 | Feb 1* | Mar 5* | Apr 17 | May 21 | June 24 | July 15 | Aug 15 | Sept 10 | Oct 17 | Nov 05 | Dec 09 |
| properties currently for sale | 13 | 20 | 22 | 32 | 33 | 26 | 30 | 24 | 24 | 26 | 28 | 27 |
| avg # of homes selling ea. month | 6 | 7.5 | 8.5 | 12 | 14.5 | 21.5 | 21 | 18 | 12 | 12 | 13 | 11 |
| M.O.I. in Red Deer | 2.2 | 2.7 | 2.6 | 2.7 | 2.3 | 1.2 | 1.4 | 1.3 | 2 | 2.2 | 2.2 | 2.5 |
SELLER’S MARKET) with an inventory rate below 3.9 months!
*Before February 2024 inventory data was from detached home sales only, now each month inventory will be posted based on homes for sale inventory overall in each community.
Still low inventory in Ponoka, Ab even though it’s looking better than other communities.
Stettler, AB (for sale inventory overall)
| Date 2024 | Jan 2 | Feb 1* | Mar 5* | Apr 17 | May 21 | June 24 | July 15 | Aug 15 | Sept 10 | Oct 17 | Nov 05 | Dec 09 |
| properties currently for sale | 21 | 30 | 24 | 24 | 26 | 25 | 24 | 20 | 22 | 29 | 27 | 24 |
| avg # of homes selling ea. month | 4 | 5 | 8 | 9 | 12.5 | 15.5 | 15 | 12.5 | 9 | 7.5 | 6.5 | 6.5 |
| M.O.I. in Red Deer | 5.3 | 6.4 | 3 | 2.7 | 2 | 1.6 | 1.5 | 1.6 | 2.4 | 3.9 | 4.2 | 3.7 |
(Balanced market) with inventory between 3.9-4.2 months-of-inventory
*Before February 2024 inventory data was from detached home sales only, now each month inventory will be posted based on homes for sale inventory overall in each community.
Stettler, Alberta is very close to a balanced market but it sees buying slow in the colder months.
Homes can sell in any market but the crucial factor is pricing. If you list your property even slightly too high, it risks lingering on the market indefinitely, especially if home prices aren’t increasing. Allowing your home to remain ‘for sale’ for months can have a detrimental impact on its current and future value.


Blake King manages iOnRealEstate.ca, catering to Central Albertans eager to stay informed about the local real estate market. Access to more information enhances decision-making, and when dealing with an asset as significant as your home, it becomes crucial to strive for the best possible decisions!
Blake King
Big Earth Realty
(403) 350-7672