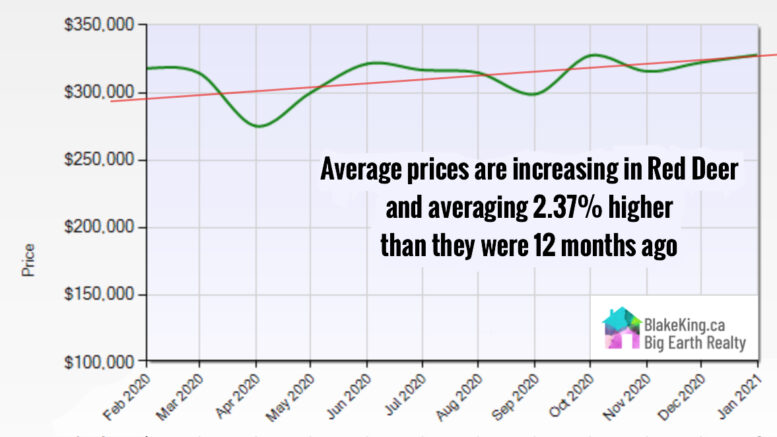

Each month I post average prices by looking at the previous months average and both the 4 and 12 month averages. I do this to see if at any point prices are trending in one direction or another.
One month’s price average is difficult to use as a gauge because it can be misleading. If only a couple of high priced homes sell in one month the average will be inaccurate.
To gauge a trend we need to watch what’s happening over a longer span and that’s why I also look at past 4 and 12 month averages.
It’s obvious there’s a trend if the average price is higher each month but there may still be a trend happening even if one month is lower than the last, as long as it still contributes to an increasing average. I try and confirm whether the average price is trending by averaging the last 4 months and comparing it to the previous 4-month average. If the average of the previous 4-month span is increasing ongoing this also can point toward a trend. If the 12-month average is increasing the trend is very clear.
Using the data below you can see in both of the 4-month groupings that each individual month’s price average isn’t necessarily higher than the one preceding but it is still contributing to a higher average.
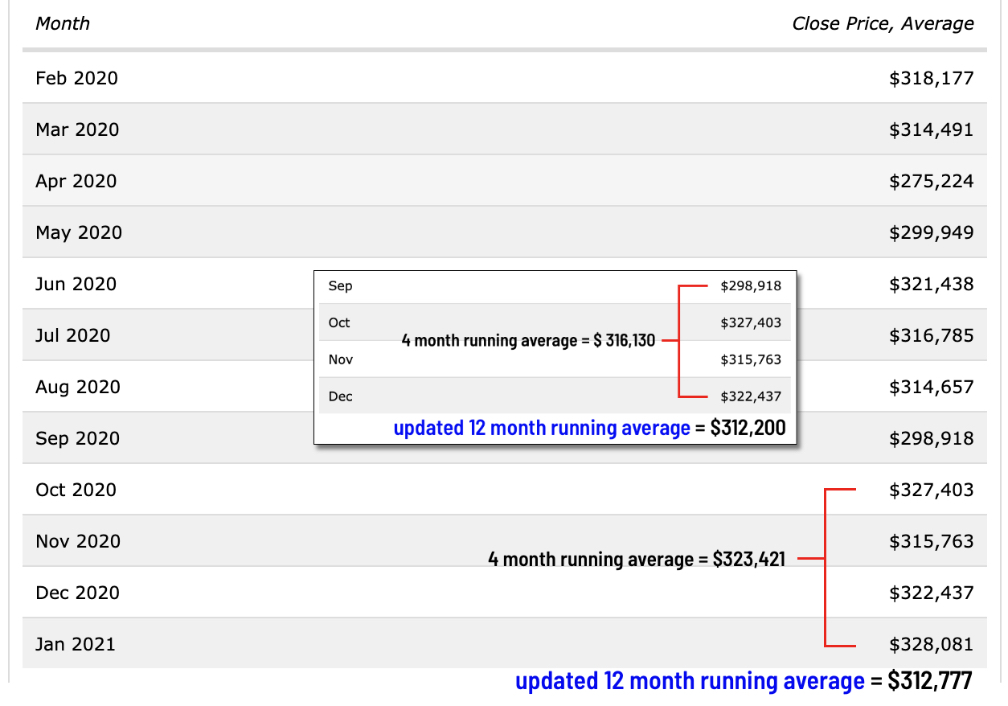
Keep in mind, two consecutive months with an increasing 4-month average may not indicate a trend but January’s average is the 5th month straight with an increasing 4-month average. In November the 4 month average was slightly lower than October’s but insignificantly.
Based on the data above we are definitely seeing an average price trend upward in the Red Deer housing market. And to confirm prices have risen and are rising I compare the 4-month averages in winter 2019/20 with winter 2020/21 below. Not only are prices increasing over the last 5 months but we can also see prices have increased 2.37% in the last 12 months
| September 2019 | $307,621 | September 2020 | $312,950 |
| October 2019 | $305,199 | October 2020 | $314,441 |
| November 2019 | $310,019 | November 2020 | $314,185 |
| December 2019 | $309,622 | December 2020 | $316,130 |
| January 2020 | $312,030 | January 2021 | $323,421 |
| Average | $308,898 | Average | $316,225 |