Are Red Deer Home Prices Resuming Their Climb? July 2026 Update
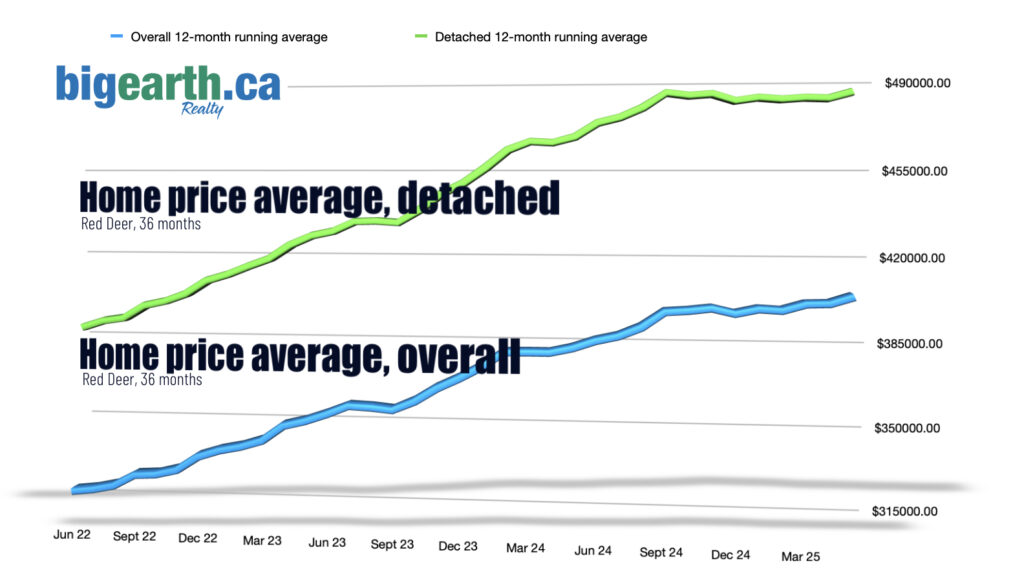
Last month, the 36-month price chart suggested Red Deer home prices might be entering a period of flattening after several years of strong appreciation. This month, the numbers tell a more encouraging story.
Both the overall and detached 6-month running averages posted solid monthly gains, and the 36-month chart has started edging upward again. While that’s positive news for homeowners, it’s still too early to conclude that prices have resumed a sustained upward trend.
One month of stronger numbers can sometimes be influenced by the mix of homes that sold. If more higher-end homes sell during a month, average prices can rise even if underlying market values haven’t changed significantly. That’s why it’s important to focus on the longer-term running averages rather than a single month’s results.
I also track home prices throughout Central Alberta. If you’d like information about your community or an estimate of your home’s current value, call or text me at (403) 350-7672 or email hello@blakeking.ca.
The table below displays the average prices for detached homes and all homes in Red Deer. It provides both the month-to-month average and the 12-month running average for each category. The data covers the past 13 months, allowing you to compare the most recent averages with those from the same month one year ago.
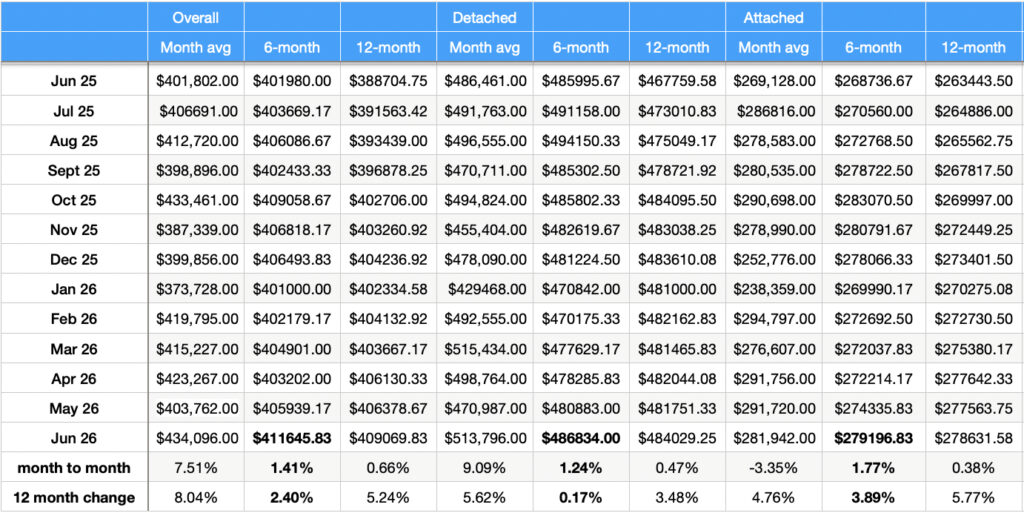
Overall Red Deer Home Prices
The overall 12-month running average now sits at $409,070, an increase of 5.24% compared with one year ago.
More importantly, the 6-month running average climbed to $411,646, increasing 1.41% from last month and 2.40% over the past year.
That represents a noticeable improvement from last month’s report and suggests price momentum has strengthened again. However, one month doesn’t establish a trend, so it will take several more months of similar data before we can say with confidence that prices are climbing again.
What the 36-Month Chart Is Showing
The updated chart reflects that change in momentum.
Last month, the graph appeared to be flattening after a long period of steady appreciation. This month’s data has nudged both the overall and detached trend lines upward once again.
That doesn’t erase the flattening we observed over recent months, but it does show the market still has upward pressure despite a more moderate pace of appreciation than we experienced through much of 2023, 2024, and early 2025.
Detached Homes
Detached homes remain the strongest segment of the Red Deer market.
The 12-month running average for detached homes is now $484,029, up 3.48% from one year ago.
The 6-month running average increased to $486,834, rising 1.24% from last month.
Detached prices continue to show resilience, supported by limited inventory and steady buyer demand.
Attached Homes
Attached homes continue to benefit from affordability.
The 12-month running average has reached $278,632, up 5.77% year over year.
The 6-month running average also increased to $279,197, gaining 1.77% over last month.
As detached home prices remain relatively high, many buyers continue to look toward duplexes, townhomes, and condominiums as affordable alternatives.
What About the Market?
While the price data improved this month, the overall market conditions haven’t changed significantly.
Red Deer still has approximately 2 months of inventory, keeping the city firmly in a seller’s market. Low inventory continues to support prices by limiting buyers’ choices. At the same time, the pace of appreciation appears much more measured than it was a year ago.
The combination of low inventory and moderating price growth means well-priced homes continue to sell quickly, while overpriced homes are taking longer to attract buyers.
Why Running Averages Matter
Monthly average prices can fluctuate considerably depending on the types of homes that happened to sell.
That’s why I rely on 6-month and 12-month running averages when evaluating market direction. They smooth out short-term swings and provide a much more reliable picture of what’s actually happening.
Right now, those averages show:
- It is still too early to know whether this is the beginning of another sustained increase or simply a stronger-than-average month.
- Home prices remain higher than one year ago.
- Short-term price momentum improved this month.
- The 36-month trend has turned upward again after showing signs of flattening.
Final Thoughts
This month’s report is certainly more encouraging than last month’s.
The latest numbers suggest the recent flattening in Red Deer home prices may have been temporary, and the longer-term trend has begun moving upward again. Even so, a single month doesn’t establish a new trend. We’ll need to see several more months of similar results before concluding that prices are climbing consistently once again.
With inventory still sitting around two months, Red Deer remains a seller’s market. Buyers continue to face limited selection, while sellers who price their homes competitively should continue to benefit from strong market conditions.

Don’t limit your search to only MLS listings – call me today at (403) 350-7672, and I’ll explain how we find pre-market and unlisted homes so you can see them before other buyers do! 📞🏡

Red Deer real estate Broker Blake King hosts iOnRealEstate.ca, a site that helps people in Central Alberta stay updated on the local real estate market. More information helps buyers and sellers make better decisions, and that’s important when it comes to an asset as valuable as your home. If you have any questions, call Blake King at (403) 350-7672.