Average home price increases again in Red Deer.
Each month I post the monthly average for homes sold in Red Deer and I also post the 4 and 12-month averages.
The monthly average is less accurate as a gauge if a couple of higher-priced homes sell.
Everyone’s interested in the average home price number but it’s actually less relevant than the ongoing averages.
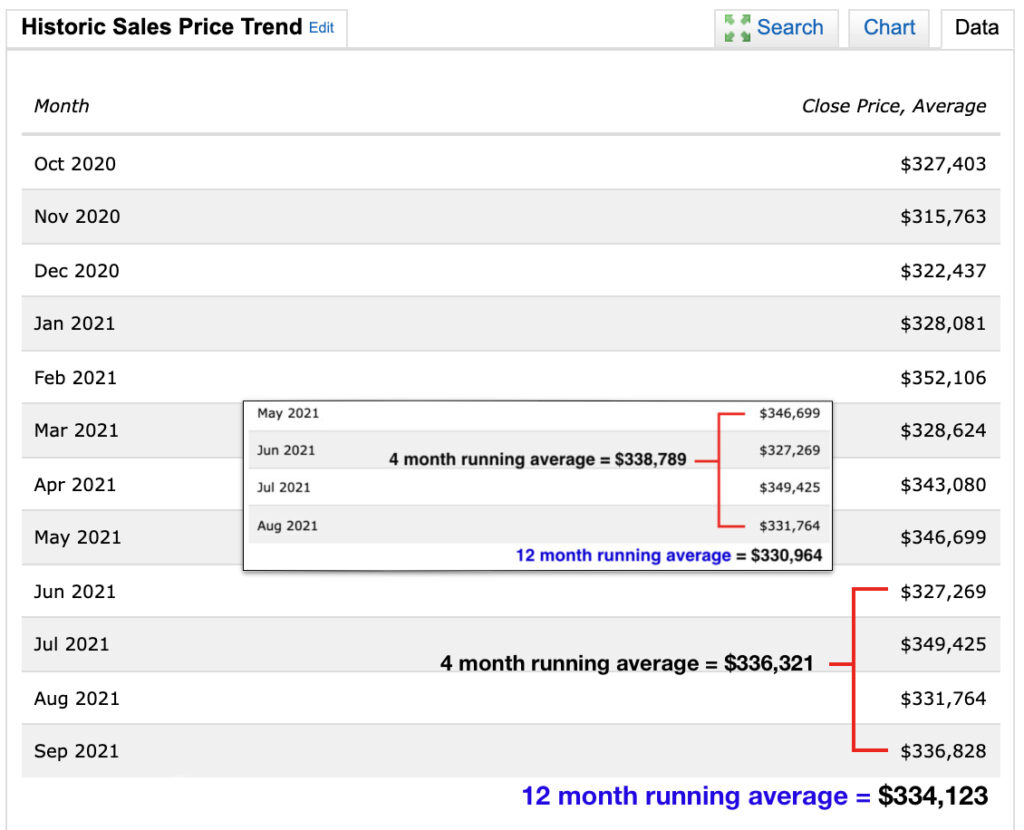
The data to the right shows how the monthly average can be all over the place and because of this the best way to see what direction a market is going it to monitor a running average.
For both the 4-month and 12-month average I tally the most recent monthly averages for each and divide them by either 4 or 12 months.
It think the most accurate way to determine if prices are trending is by monitoring the 12-month average. The 12-month average shows a person what’s happening as new months register in the average and as months over a year ago dissapear.
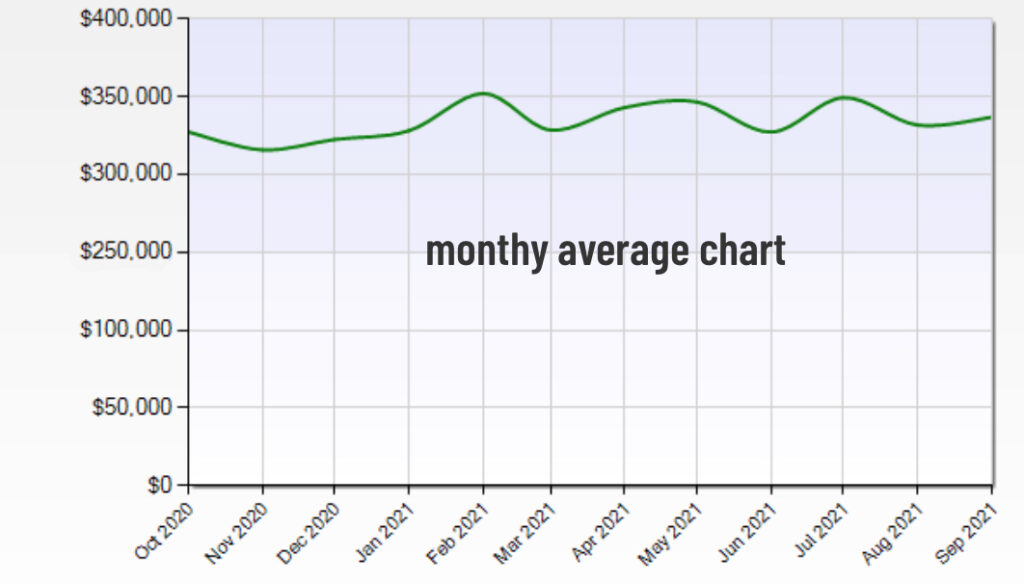
If we look at a chart of the month to month averages (to the right) we can sort of see a direction the market it taking but it’s more clear when we chart the 12-month running average (top of page).
We can see looking at the chart at the top of the page that prices are gradually increasing. I’m going to continue tracking and charting the twelve month average so everyone can see trends as our market changes.