I’ve simplified this month’s average price report for Red Deer but I’m also going add some data. Up until now I’ve posted the overall monthly average, the overall 4-month running average, and the overall 12-month running average (R.A).
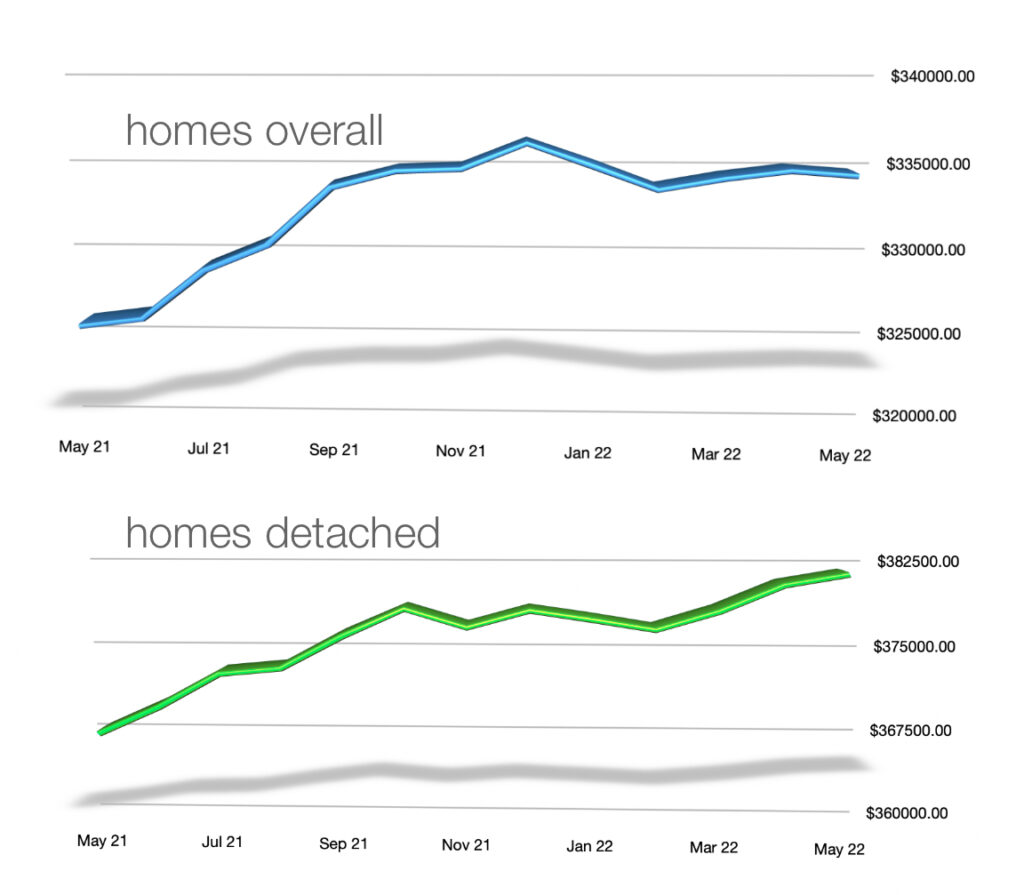
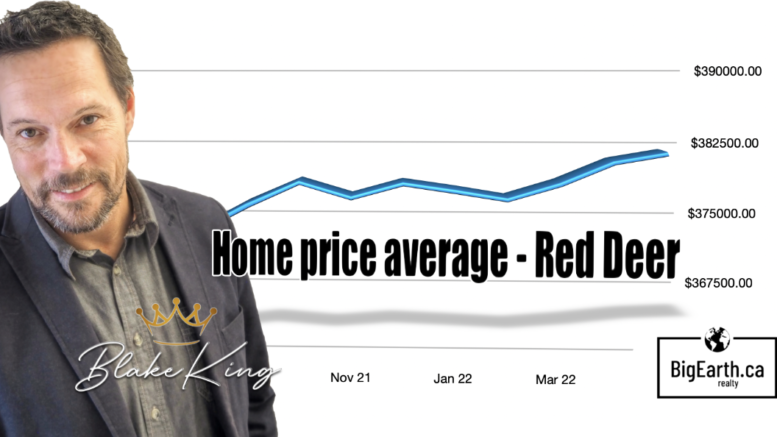
Starting this month I’m going post the overall price averages and the detached home averages. In addition to that I will chart the twelve month average so we can see which way our market is trending.
I’ve mentioned how the month-to-month average is difficult to use as a gauge because it can be skewed by a few extra high or low sales in one month. The 12-month average gives the best view of how the market is gradually changing.
The best way to track what a real estate market is doing is to look at longer averages. It probably takes at least a 6-month average to determine if prices are trending. So, instead of posting two running averages we will track the 12-month running average.
Above, the 12-month running average is the average using the most recent 12 monthly averages.
Also, up until now I’ve only posted each average and its previous month’s average to compare. Now, in the table I’ll post each month, below, you’ll be able to compare month to month and the most recent month to the same month a year earlier.
| Overall | ooo | Detached | |||
| Month | Average | 12-month avg. | Average | 12-month avg. | |
| May 2021 | $346,775 | $326,376 ⬆︎ | $385,476 | $368,426 ⬆︎ | |
| June 2021 | $326,821 | $326,825 ⬆︎ | $375,915 | $370,723 ⬆︎ | |
| July 2021 | $349,760 | $329,573 ⬆︎ | $393,524 | $373,547 ⬆︎ | |
| Aug 2021 | $331,872 | $331,007 ⬆︎ | $364,618 | $374,030 ⬇︎ | |
| Sept 2021 | $336,945 | $334,176 ⬆︎ | $378,152 | $376,759 ⬆︎ | |
| Oct 2021 | $338,241 | $335,080 ⬆︎ | $387,660 | $379,032 ⬆︎ | |
| Nov 2021 | $317,237 | $335,202 ⬆︎ | $354,631 | $377,512 ⬇︎ | |
| Dec 2021 | $339,214 | $336,600 ⬆︎ | $383,808 | $378,933⬆︎ | |
| Jan 2022 | $313,546 | $335,389 ⬇︎ | $366,410 | $378,197 ⬇︎ | |
| Feb 2022 | $337,430 | $334,116 ⬇︎ | $384,932 | $377,388 ⬇︎ | |
| Mar 2022 | $335,975 | $334,728 ⬆︎ | $393,789 | $378,929 ⬆︎ | |
| Apr 2022 | $348,134 | $335,163 ⬆︎ | $404,061 | $381,081 ⬆︎ | |
| May 2022 | $343,666 | $334,903 ⬇︎ | $396,107 | $381,967 ⬆︎ |

May’s monthly home price average overall was $343,666. Down 1.3% from April’s average and down 0.9% from May 2021.
May’s monthly home price average for detached homes in Red Deer is $396,107. Down 2% from April’s detached home average but up 2.8% from May 2021.
The 12-month running average overall has increased 9 of the last 12-months and 8 of the last 12 with detached homes. May’s 12-month running average dipped a bit from April but is 2.6% higher than May 2021. The detached home 12-month running price average was only a little higher in May over April but 3.7% higher than last May
Prices have been increasing because our homes-for-sale inventory has been very low for a long time. We are already started to see the number of homes available for sale increase and might see price charts flatten out.

Hosted by Blake King Realtor® and Big Earth Realty. Blake continually monitors the Red Deer and Central Alberta real estate market to track changes and watch trends so he can help his clients make the most informed decisions, buying or selling. If you want to learn more about how local market stats impact your next real estate transaction call or email Blake anytime (403) 350-7672 or hello@blakeking.ca


